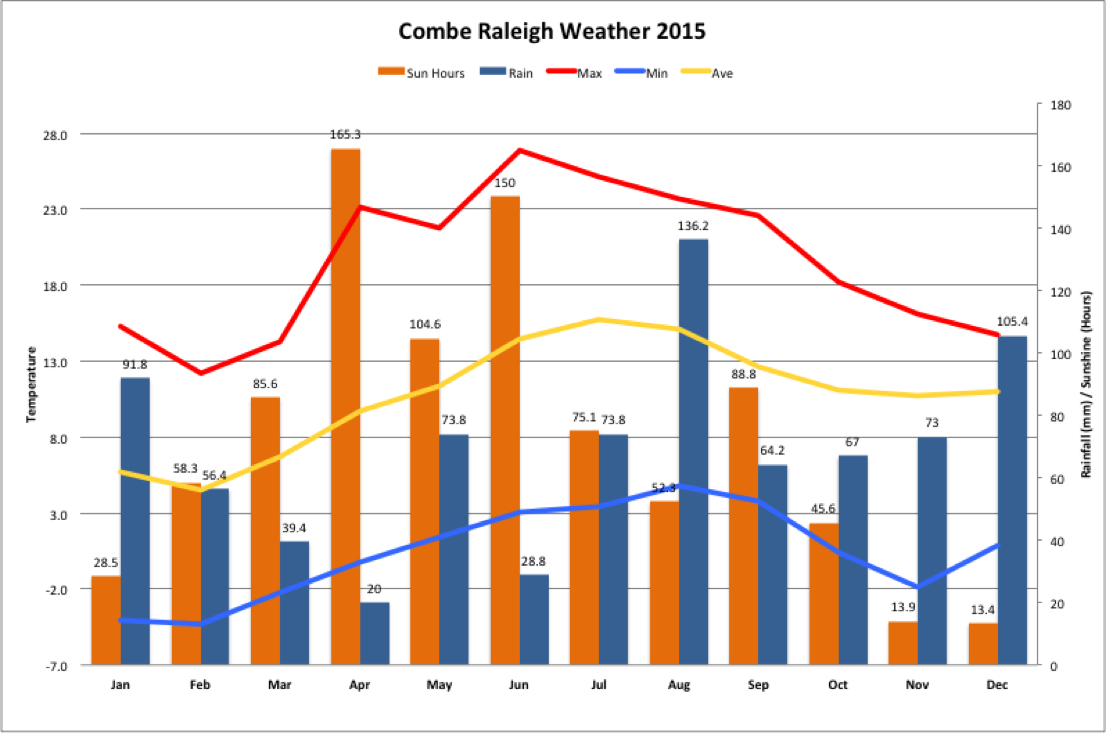
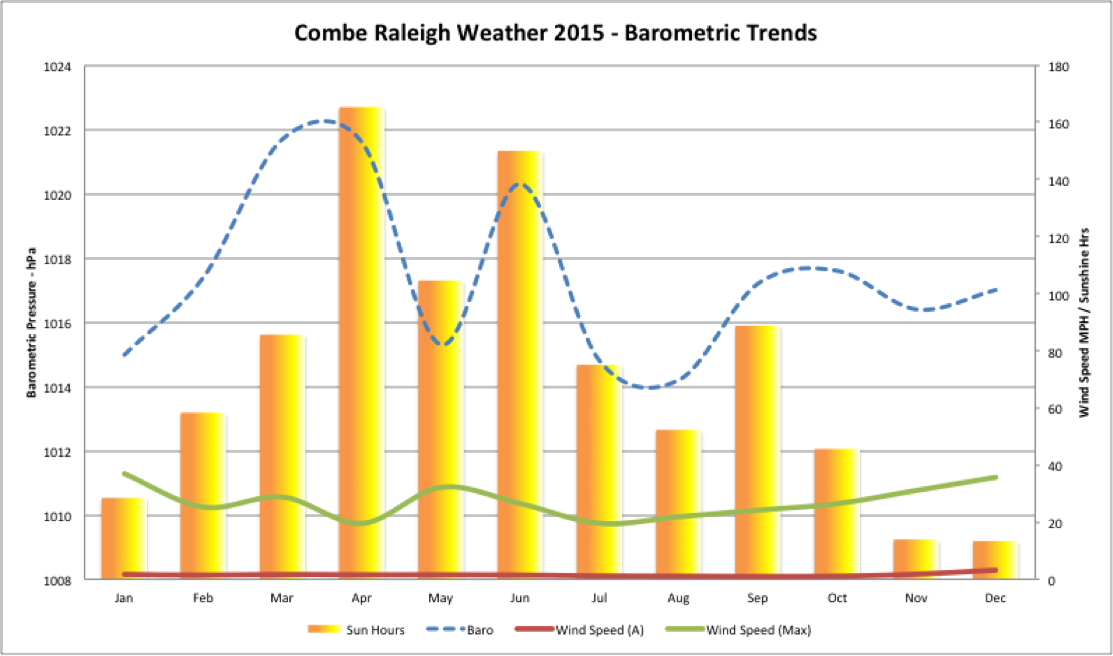
It was a fairly quiet meteorological year, where we experienced a fairly warm but moist summer and very few frosts over the winter. We are currently having warm weather over Christmas and New Year, which is quite unseasonal.
A review of the measured data points shows that 2015 has been warm, and slightly dryer than previous years, not that it feels that way at the moment!
Our weather monitoring has been reliable this year, after some preventative maintenance and moving of the measurement station prior to our building work over the summer. This has had a small effect on the measurements taken, but nothing worth noting. I really must move the Anemometer to a higher position, to get a better reading for wind strength and direction, which is affected by the church tower and the woodland.
The annual rainfall over 2015 was 829.8 mm, compared with 2014 with 1115.2 mm, so moderately less rainfall. The wettest month by volume was August, with 132.6 mm where it rained for 15 days. December was notable with 29 days of rainfall. The driest month was April, with 9 rain days and 20 mm. The Met Office yearly average for England was 883 mm.
Temperatures were down from last year, with the yearly average temperature dropping to 10.8°C, from 11.1°C in 2014. The Met Office yearly average for England was 10.2°C. Over the year, temperature data recorded 15 days above 22°C, with no days dropping below -5°C. The lowest recorded temperature recorded was -4.3°C on 2nd February, at 7:14 am. The highest recorded temperature was 26.9°C on 30th June at 3:45 pm.
The Met Office confirmed that December was the warmest December since records began in 1910.
April and June were the peak months for Sunshine hours, with a total of 881.4 Hrs. This was down from last year’s value of 951.9 Hrs.
Again, we had no snow recorded but 35 ground frosts. Interestingly, there were no frosts in December because of the unseasonal warm weather.
Comparing with an average across the 4 years we have been recording weather here in Combe Raleigh, the following table shows how 2015 compared;
|
|
|
Annual Average Temp |
Annual Rainfall |
|
2012-14 |
10.3 °C |
1080.9 mm |
|
|
2012 |
9.7 °C |
1288.2 mm |
|
|
2013 |
10.1 °C |
839.4 mm |
|
|
2014 |
11.1 °C |
1115.2 mm |
|
|
2015 |
10.8 °C |
829.8 mm |
Recorded weather data
Average temperature = 10.8°C
Average humidity = 87%
Average dewpoint = 8.5°C
Average barometer = 1017.4 mb
Average windspeed = 1.6 mph
Average gustspeed = 3.4 mph
Average direction = 188° ( S )
Rainfall for year = 829.8 mm
Maximum rainfall per minute = 1.2 mm on 22nd August at 3:40 pm
Maximum temperature = 26.9°C on 30th June at 3:45 pm
Minimum temperature = -4.3°C on 2nd February at 7:14 am
Maximum pressure = 1042.6 mb on 1st February at 12:51 am
Minimum pressure = 978.5 mb on 11th January at 5:28 am
Maximum windspeed = 16.1 mph 180°( S ) on 31st December at 11:57 am
Maximum gust speed = 36.8 mph 180°( S ) on 14th January at 11:07 am
Maximum UV Index = 8.6 on 6th July
Maximum Solar = 1294 W2m on 9th June
Maximum Sunshine Hours = 11.5 hrs on 7th June
Total Sunshine Hours = 881.4 hrs
Maximum Radiation Exposure = 14.71 cpm ( 0.13 µSv) on 7th March
Minimum Radiation Exposure = 7.5 cpm ( 0.06 µSv) on 1st November


Keep visiting www.comberaleighweather.co.uk for continuous updates in real time, and weather forecasts for the local area.
We are really interested in who visits our website, so feel free to drop us a message via the contact us page. Google Analytics shows us that we have regular returning visitors from the local area, as well as further afield, both in the UK and Internationally.
