The Weather in Combe Raleigh in 2019
After the hot summer of 2018, there were the beginnings of another warm, dry summer for 2019 but that all fell apart in June with 20 rain days. As I sit compiling the data in the first days of January 2020, already 3 days have been +3oC on the long term average.
After the events of 2018, I didn’t have the time or capacity to compile the weather records for the year. I have included the data for both years, hopefully it is not too confusing.
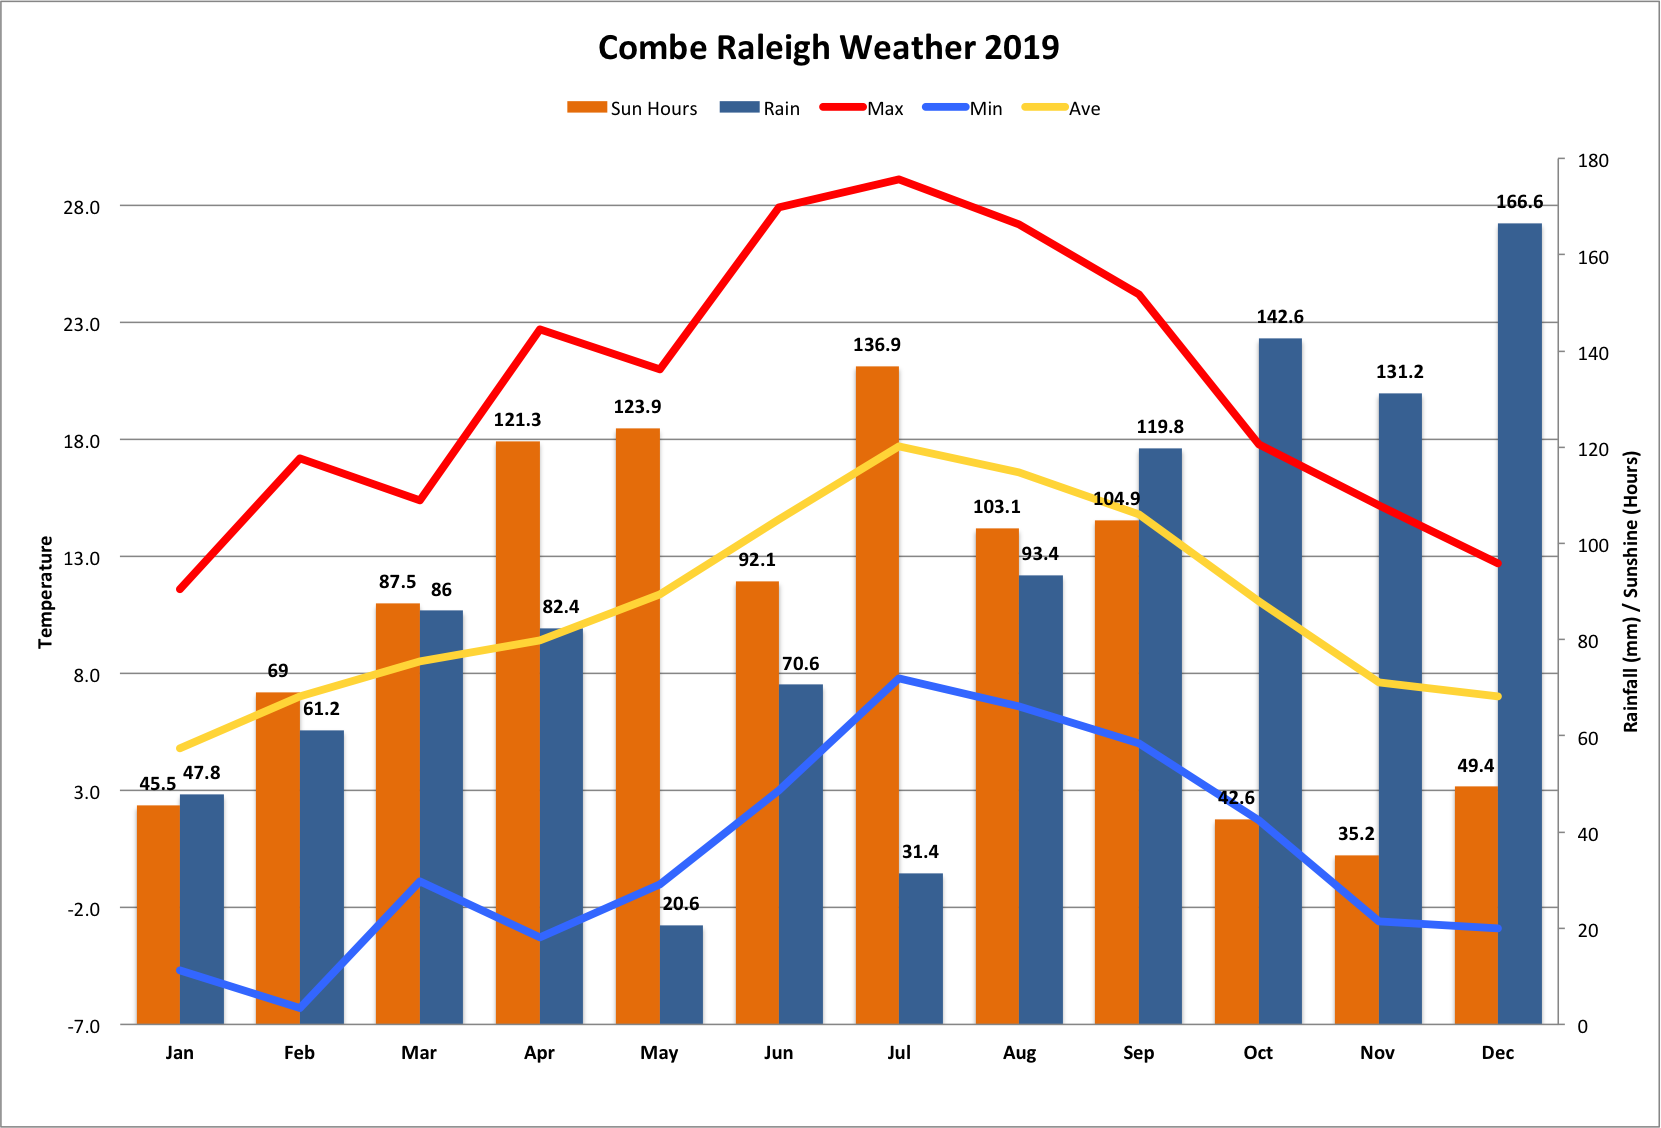
2019 brought us 1053.6mm of annual rainfall, which is an increase of 78.2mm or approx. 3 inches from 2018, at 975.4 mm. In 2019, we experienced 199 days where it rained more than 0.2mm, in 2018 it was 184 days. The wettest 2019 month by volume was December, with 166.6 mm where it rained ( > 0.2mm) for 21 days, with the wettest day being the 18th with 24.8 mm. The driest month in 2019 was May, with 9 rain days and 20.6 mm. The Met Office yearly average for SW England was 1403.0 mm (2018 was 1265.8 mm) and 168 days (2018 was 149) where it rained more than 1 mm. (Note the differing rain day parameter)
Our temperatures were actually up from last year, with the yearly average temperature rising to 10.9°C, from 10.7 °C in 2018. The Met Office yearly average for SW England was 10.4 °C (2018 was 10.5° C).
Over the 2019 year, temperature data recorded 44 days above 22°C, with 1 day dropping below -5°C (3rd Feb). In 2018, that was 55 days above 22°C, with 2 days dropping below -5°C (28th Feb, 1st March).
The lowest recorded 2019 temperature recorded was -6.3°C on 3rd February, at 7:55 am. The highest recorded 2019 temperature was 29.1°C on 25th July at 2:30pm.
In 2018, lowest recorded temperature recorded was -6.0°C on 1st March, at 12:59 am. The highest recorded temperature was 29.9°C on 8th July at 3:49 pm.
In 2019, we had no Ice Days recorded (days where the temp did not rise above 0°C). 2018 experienced 3 Ice Days (28th Feb, 1st March, 18th March).
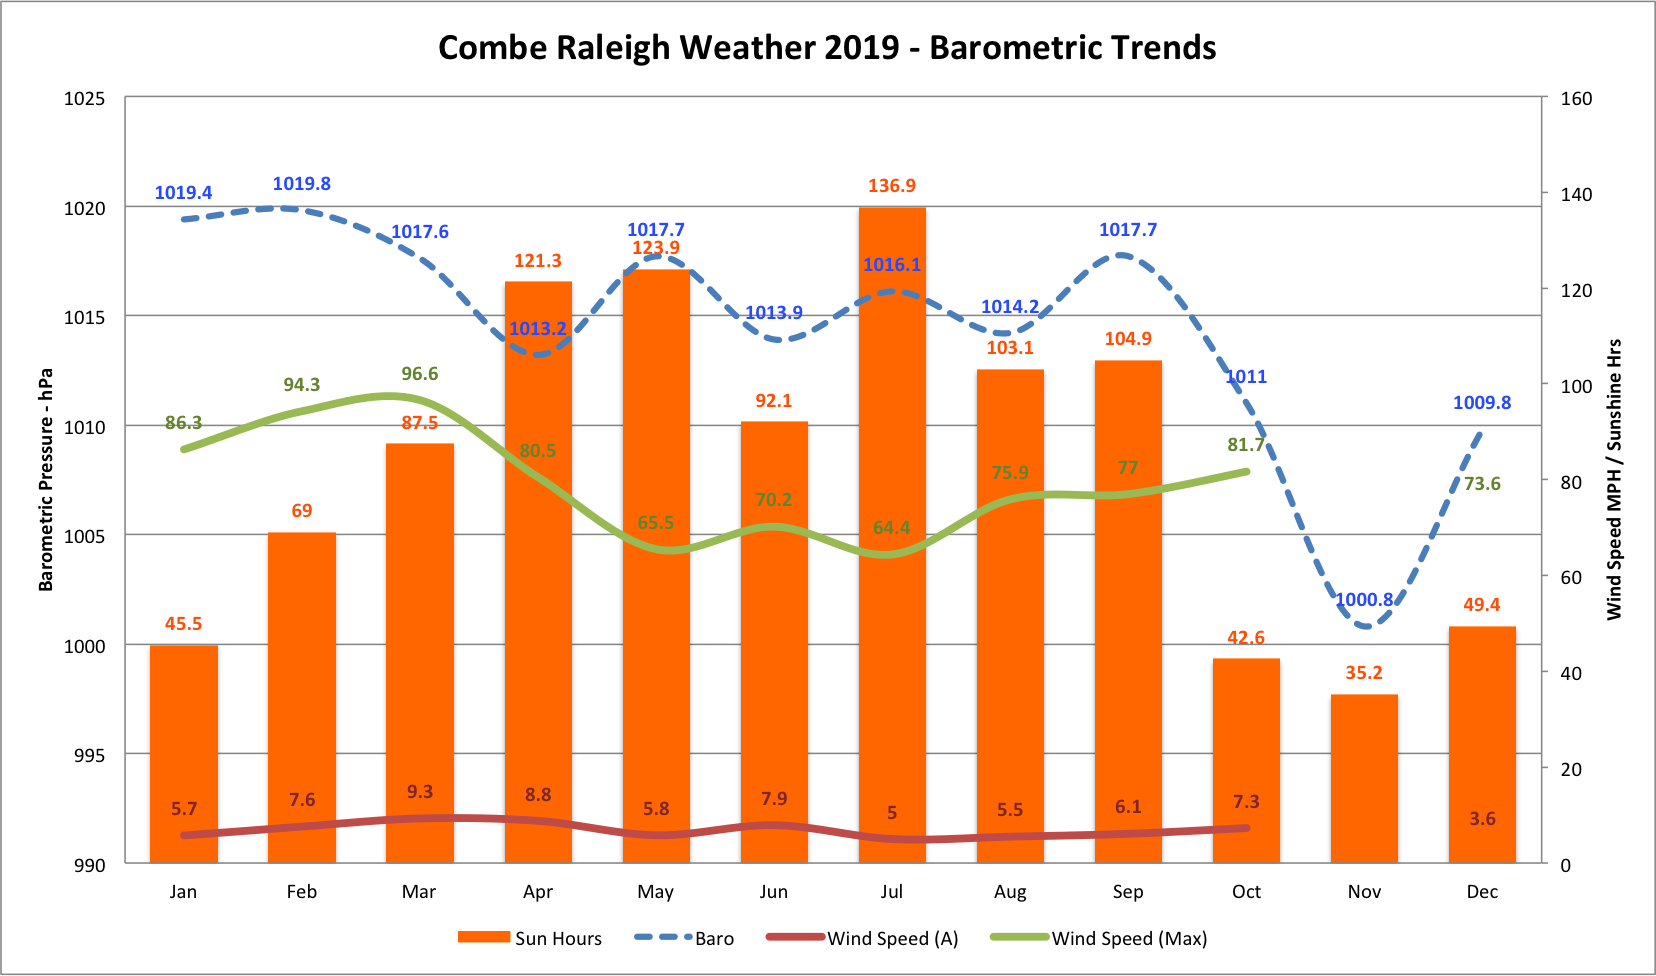
May and July were the peak months for sunshine hours, with an annual total of 1011.4 Hrs. 965.6 hrs recorded for 2018.
Station reliability has been fairly good this year, although an intermittent fault with the Anemometer in November resulted in no wind speed readings. I didn’t have time to climb on the roof to take a look, and then it came back by itself. I’d better inspect when the weather gets better or it stops again ! There is also a solar power fault on the Soil and Leaf wetness sensors, which I hope to fix soon but requires some soldering and replacement components.
In 2020, the computer hardware that runs the weather station will be replaced and the website updated as it’s been running since we moved in 2012 without much change apart from the odd reboot. Please contact me if you’d like to see how everything is connected up and how all this data is recorded, displayed on the internet and shared for research purposes.
Summary daily data – 2019 (2018)
Number of days where …
Max. Temp. exceeded/equalled 22 °C was 44 (55)
Max. Temp. was lower than 0 °C (Ice day) was 0 (3)
Min. Temp. was lower than -5 °C was 1 (2)
Precipitation exceeded/equalled 0.2mm was 199 (184)
Precipitation exceeded/equalled 2.5mm was 102 (105)
Frost Days – 47 (46) – (days where the air temp was lower than 0 °C at any point.)
Recorded weather data
Average temperature = 10.9°C (10.7°C)
Average humidity = 85% (79%)
Average dew point = 7.2°C (5.7°C)
Average barometer = 1016.5 mb (1014.7 mb)
Average wind speed = 6.0 mph (7.6 mph)
Average gust speed = 11.0 mph (13.5 mph)
Average direction = 200° SSW (60° ENE)
Rainfall for year = 1053.6 mm (975.4 mm)
Maximum rain per minute = 1.4 mm/min on 9th August at 3.31 am (1.0 mm/min on 30th July at 5:27 pm)
Maximum temperature = 29.1°C on 25th August at 3:40pm (29.9°C on 8th July at 3:49 pm)
Minimum temperature = -6.3°C on 3rd February, at 7:55 am (-6.0°C on 1st March, at 12:59 am)
Maximum pressure = 1044.4 mb on 4th January at 7:50 pm (1039.6 mb on 4th September at 7:50 pm)
Minimum pressure = 967.8 mb on day 3rd December at 00:00 am (982.4 mb on 3rd March at 00:00 am)
Maximum wind speed = 59.8 mph 86°( E ) on 12th March at 7:12 am (59.8 mph 188°( S ) on 28th November at 1:53 pm)
Maximum gust speed = 96.6 mph 272°( W ) on 15th March at 12:39 pm (98.9 mph 146°(SE) on 12th October at 9:37 pm)
Maximum UV Index = 8.9 on 1st July (7.2 on 21st July)
Maximum Solar = 1315 W2m on 1st July (1165 W2m on 17th August)
Maximum Sunshine Hours = 10.9 hrs on 22nd June (10.8 hrs on 28th June)
Total Sunshine Hours = 1011.4 hrs (965.6 hrs)
Comparing with an average across the 8 years we have been recording weather here in Combe Raleigh, the following table shows how 2019 compared;
| Annual Average Temp | Annual Rainfall | ||
| Ave. 2012-19 | 10.5 °C | 969.3 mm | |
| 2012 | 9.7 °C | 1288.2 mm | |
| 2013 | 10.1 °C | 839.4 mm | |
| 2014 | 11.1 °C | 1115.2 mm | |
| 2015 | 10.8 °C | 829.8 mm | |
| 2016 | 10.6 °C | 891.8 mm | |
| 2017 | 10.7 °C | 760.6 mm | |
| 2018 | 10.7 °C | 975.4 mm | |
| 2019 | 10.9 °C | 1053.6 mm |