
Uncategorised
The Weather in Combe Raleigh in 2019
After the hot summer of 2018, there were the beginnings of another warm, dry summer for 2019 but that all fell apart in June with 20 rain days. As I sit compiling the data in the first days of January 2020, already 3 days have been +3oC on the long term average.
After the events of 2018, I didn’t have the time or capacity to compile the weather records for the year. I have included the data for both years, hopefully it is not too confusing.
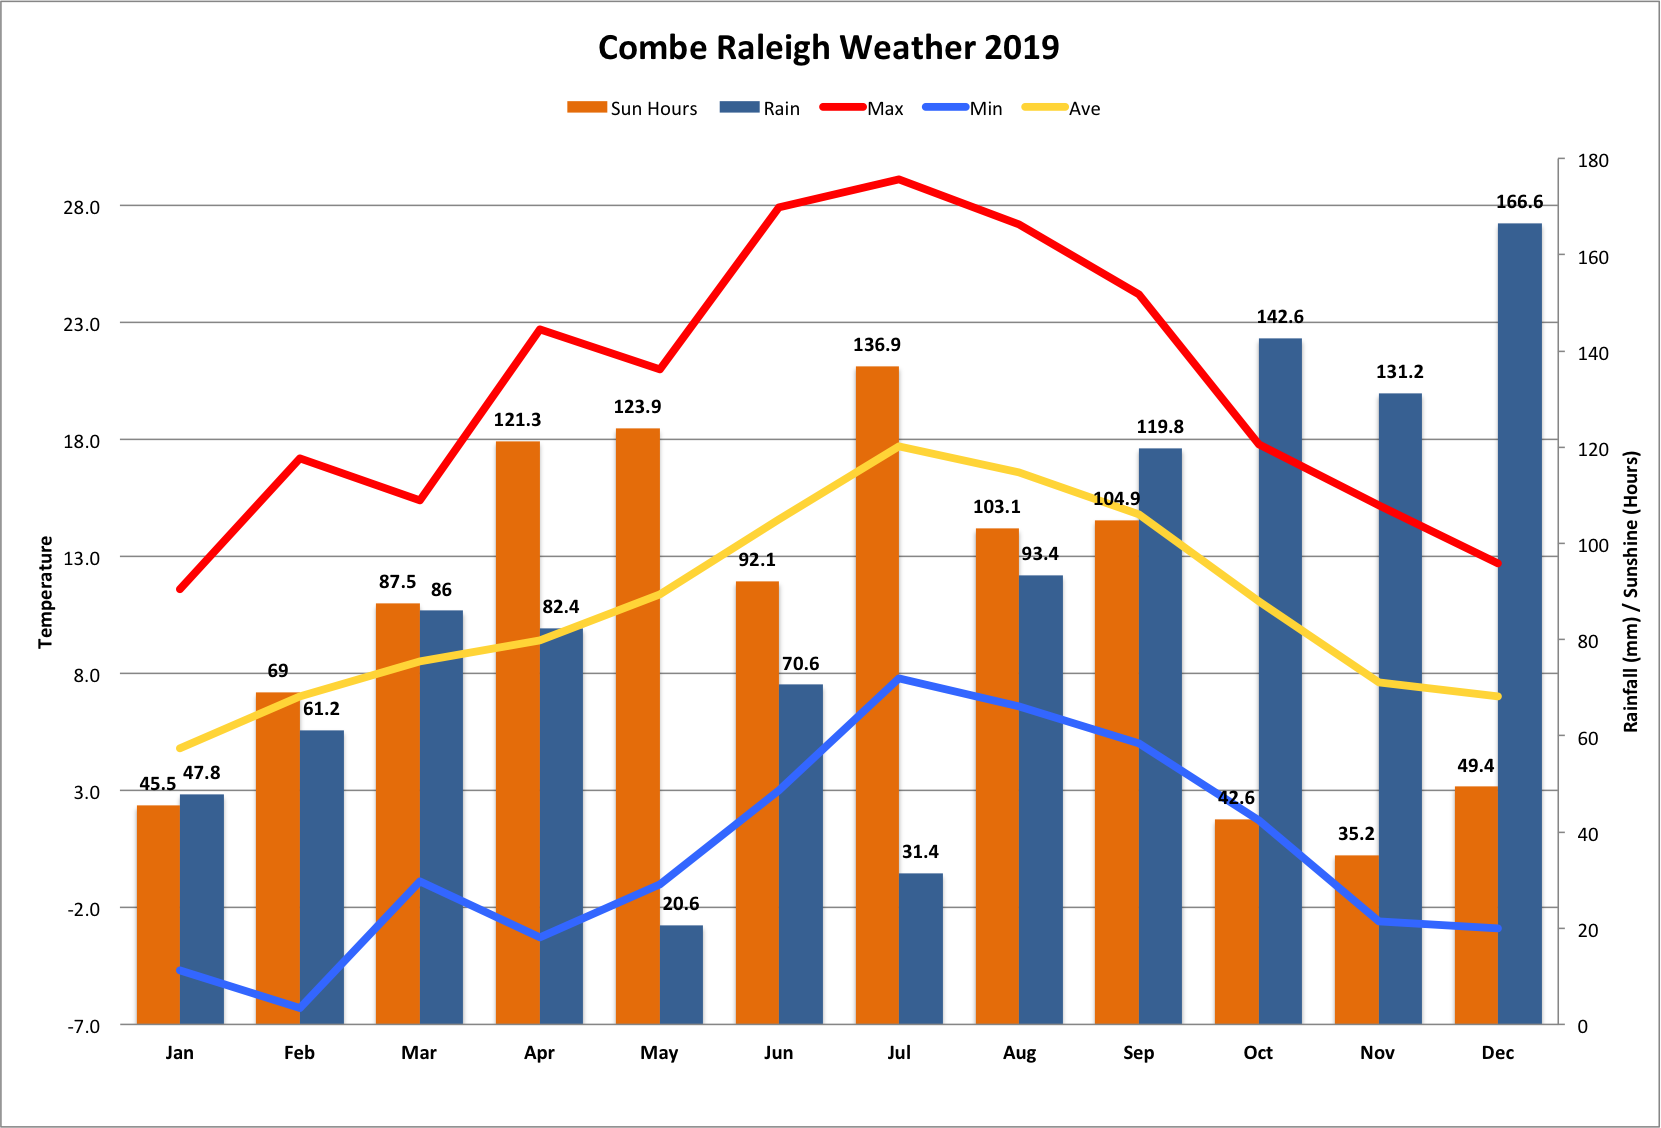
2019 brought us 1053.6mm of annual rainfall, which is an increase of 78.2mm or approx. 3 inches from 2018, at 975.4 mm. In 2019, we experienced 199 days where it rained more than 0.2mm, in 2018 it was 184 days. The wettest 2019 month by volume was December, with 166.6 mm where it rained ( > 0.2mm) for 21 days, with the wettest day being the 18th with 24.8 mm. The driest month in 2019 was May, with 9 rain days and 20.6 mm. The Met Office yearly average for SW England was 1403.0 mm (2018 was 1265.8 mm) and 168 days (2018 was 149) where it rained more than 1 mm. (Note the differing rain day parameter)
Our temperatures were actually up from last year, with the yearly average temperature rising to 10.9°C, from 10.7 °C in 2018. The Met Office yearly average for SW England was 10.4 °C (2018 was 10.5° C).
Over the 2019 year, temperature data recorded 44 days above 22°C, with 1 day dropping below -5°C (3rd Feb). In 2018, that was 55 days above 22°C, with 2 days dropping below -5°C (28th Feb, 1st March).
The lowest recorded 2019 temperature recorded was -6.3°C on 3rd February, at 7:55 am. The highest recorded 2019 temperature was 29.1°C on 25th July at 2:30pm.
In 2018, lowest recorded temperature recorded was -6.0°C on 1st March, at 12:59 am. The highest recorded temperature was 29.9°C on 8th July at 3:49 pm.
In 2019, we had no Ice Days recorded (days where the temp did not rise above 0°C). 2018 experienced 3 Ice Days (28th Feb, 1st March, 18th March).
May and July were the peak months for sunshine hours, with an annual total of 1011.4 Hrs. 965.6 hrs recorded for 2018.
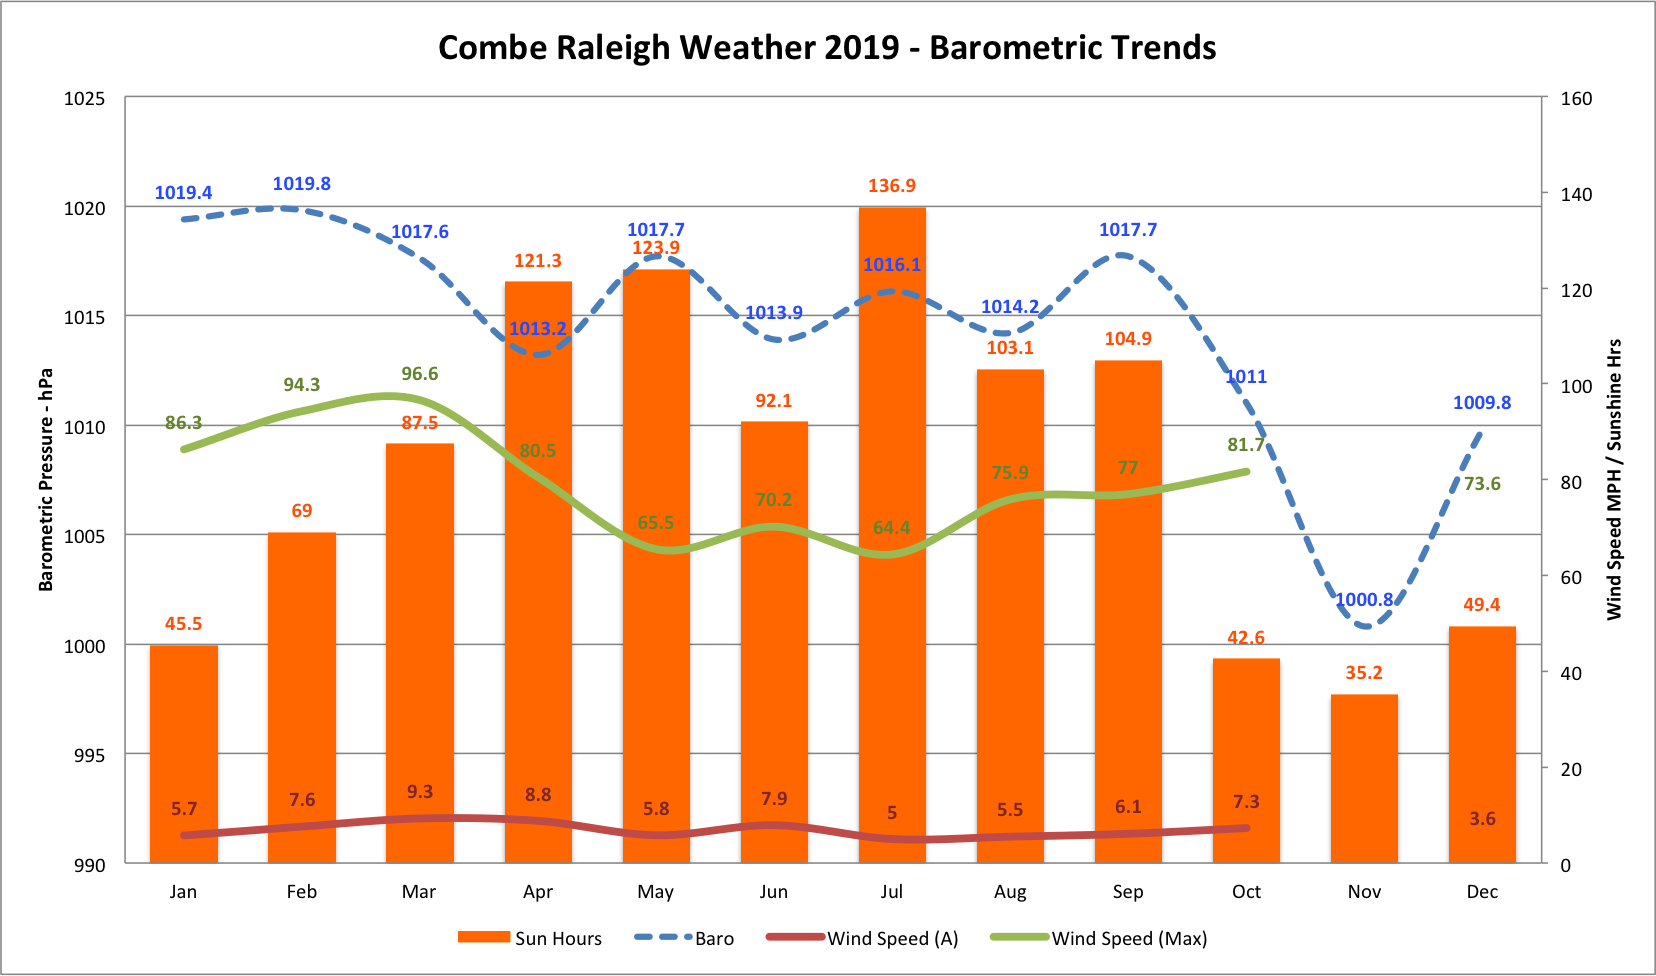
Station reliability has been fairly good this year, although an intermittent fault with the Anemometer in November resulted in no wind speed readings. I didn’t have time to climb on the roof to take a look, and then it came back by itself. I’d better inspect when the weather gets better or it stops again ! There is also a solar power fault on the Soil and Leaf wetness sensors, which I hope to fix soon but requires some soldering and replacement components.
In 2020, the computer hardware that runs the weather station will be replaced and the website updated as it’s been running since we moved in 2012 without much change apart from the odd reboot. Please contact me if you’d like to see how everything is connected up and how all this data is recorded, displayed on the internet and shared for research purposes.
Summary daily data – 2019 (2018)
Number of days where …
Max. Temp. exceeded/equalled 22 °C was 44 (55)
Max. Temp. was lower than 0 °C (Ice day) was 0 (3)
Min. Temp. was lower than -5 °C was 1 (2)
Precipitation exceeded/equalled 0.2mm was 199 (184)
Precipitation exceeded/equalled 2.5mm was 102 (105)
Frost Days – 47 (46) – (days where the air temp was lower than 0 °C at any point.)
Recorded weather data
Average temperature = 10.9°C (10.7°C)
Average humidity = 85% (79%)
Average dew point = 7.2°C (5.7°C)
Average barometer = 1016.5 mb (1014.7 mb)
Average wind speed = 6.0 mph (7.6 mph)
Average gust speed = 11.0 mph (13.5 mph)
Average direction = 200° SSW (60° ENE)
Rainfall for year = 1053.6 mm (975.4 mm)
Maximum rain per minute = 1.4 mm/min on 9th August at 3.31 am (1.0 mm/min on 30th July at 5:27 pm)
Maximum temperature = 29.1°C on 25th August at 3:40pm (29.9°C on 8th July at 3:49 pm)
Minimum temperature = -6.3°C on 3rd February, at 7:55 am (-6.0°C on 1st March, at 12:59 am)
Maximum pressure = 1044.4 mb on 4th January at 7:50 pm (1039.6 mb on 4th September at 7:50 pm)
Minimum pressure = 967.8 mb on day 3rd December at 00:00 am (982.4 mb on 3rd March at 00:00 am)
Maximum wind speed = 59.8 mph 86°( E ) on 12th March at 7:12 am (59.8 mph 188°( S ) on 28th November at 1:53 pm)
Maximum gust speed = 96.6 mph 272°( W ) on 15th March at 12:39 pm (98.9 mph 146°(SE) on 12th October at 9:37 pm)
Maximum UV Index = 8.9 on 1st July (7.2 on 21st July)
Maximum Solar = 1315 W2m on 1st July (1165 W2m on 17th August)
Maximum Sunshine Hours = 10.9 hrs on 22nd June (10.8 hrs on 28th June)
Total Sunshine Hours = 1011.4 hrs (965.6 hrs)
Comparing with an average across the 8 years we have been recording weather here in Combe Raleigh, the following table shows how 2019 compared;
| Annual Average Temp | Annual Rainfall | ||
| Ave. 2012-19 | 10.5 °C | 969.3 mm | |
| 2012 | 9.7 °C | 1288.2 mm | |
| 2013 | 10.1 °C | 839.4 mm | |
| 2014 | 11.1 °C | 1115.2 mm | |
| 2015 | 10.8 °C | 829.8 mm | |
| 2016 | 10.6 °C | 891.8 mm | |
| 2017 | 10.7 °C | 760.6 mm | |
| 2018 | 10.7 °C | 975.4 mm | |
| 2019 | 10.9 °C | 1053.6 mm |
The Weather in Combe Raleigh in 2017
We’ve just had the wettest Christmas since we started recording weather in Combe Raleigh ! But that’s not the full meteorological story of 2017. We’ve enjoyed high temperatures and sunshine in June and high winds in the autumn. Let’s look at the high’s and lows …
We had a dry year in comparison to the historical record, with 760.6mm annual rainfall, which is 131.2 mm less than 2016, at 891.8 mm. We had 197 days where it rained more than 0.2mm. The wettest month by volume was December, with 113.8 mm where it rained ( > 0.2mm) for 23 days, with the wettest day being the 25th (Christmas Day !) with 24.6 mm. The driest month was April, with 5 rain days and 28.8 mm. The Met Office yearly average for SW England was 1220.2 mm and 164.1 days where it rained more than 0.2mm.
Temperatures were up from last year, with the yearly average temperature rising to 10.7°C, from 10.6°C in 2016. The Met Office yearly average for SW England was 10.5°C. Over the year, temperature data recorded 22 days above 22°C, with no days dropping below -5°C. The lowest recorded temperature recorded was -4.8°C on 3rd January, at 7:24 am. The highest recorded temperature was 30.0°C on 20th June at 3:40pm.
May and June were the peak months for Sunshine hours, with an annual total of 845.5 Hrs.
We had 35 ground frosts, with no Ice Days recorded (days where the temp did not rise above 0°C). The Met Office frost days for SW England was 29.8.
Our weather recording equipment had a couple of failures this year, one due to a faulty backup battery and unfortunately a more expensive PCB failure on the Soil Temp module. The Temp/Humidity module also displayed a problem, however this part needs to be changed periodically so was not totally unexpected.
As predicted last year, the relocation of the anemometer has provided a much better indicator of wind speed and direction, resulting in a less sheltered and eddy-affected measurement. We recorded a record high wind speed in December of 43 Mph.
Summary daily data
Number of days where …
Max. Temp. exceeded/equalled 22 °C was 25.
Max. Temp. was lower than 0 °C was 0. (No Ice days)
Min. Temp. was lower than -5 °C was 0.
Precipitation exceeded/equalled 0.2mm was 197.
Precipitation exceeded/equalled 2.5mm was 96.
Recorded weather data
Average temperature = 10.7°C
Average humidity = 82%
Average dew point = 7.2°C
Average barometer = 1016.5 mb
Average wind speed = 2.0 mph
Average gust speed = 4.0 mph
Average direction = 238° (WSW)
Rainfall for year = 760.6 mm
Maximum rain per minute = 1.6 mm/min on day 25th December at 6:27pm
Maximum temperature = 30.0°C on 20th June at 3:40pm
Minimum temperature = -4.8°C on 3rd January, at 7:24 am
Maximum pressure = 1038.4 mb on 1st January at 0:37am
Minimum pressure = 976.0 mb on day 1st December at 07:36am
Maximum wind speed = 23.0 mph 142°(SE) on 31st January at 8:40am
Maximum gust speed = 42.6 mph 221°(SW) on 29thth December at 7:28am
Maximum UV Index= 9.3 on 12th July at 1:31pm
Maximum Solar = 1329 W2m on 9th June
Maximum Sunshine Hours = 11.0 hrs on 18th June
Total Sunshine Hours = 845.5 hrs
And I say it every year, Still no Snow !
Comparing with an average across the 6 years we have been recording weather here in Combe Raleigh, the following table shows how 2017 compared;
|
|
|
Annual Average Temp |
Annual Rainfall |
|
Ave. 2012-17 |
10.5 °C |
954.2 mm |
|
|
2012 |
9.7 °C |
1288.2 mm |
|
|
2013 |
10.1 °C |
839.4 mm |
|
|
2014 |
11.1 °C |
1115.2 mm |
|
|
2015 |
10.8 °C |
829.8 mm |
|
|
2016 |
|
10.6 °C |
891.8 mm |
|
2017 |
|
10.7 °C |
760.6 mm |
The Weather in Combe Raleigh in 2016 - (Published in the Raleigh Rag)
Over 2016, the weather was very mild and the summer was quite warm. A sunny May and August and a dry July provided a good summer for once. If you remember August 2015, it was really wet and less than half of the sunshine of this year. It was nice to enjoy the sunshine in the garden for once !
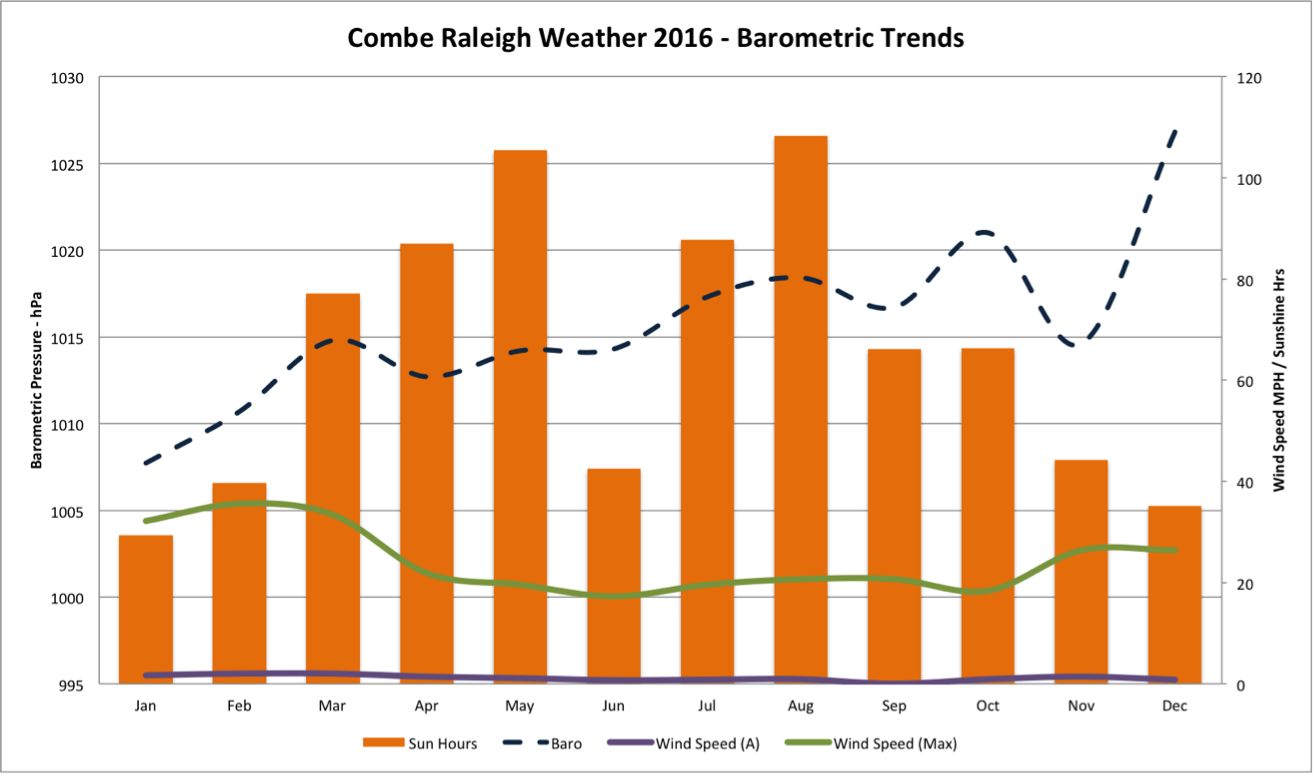
The Weather Station worked faultlessly this year, and we managed to re-locate the anemometer to a higher point, so wind indications for 2017 will show a more accurate value, in line with the flag waving on St Nicholas Tower ! There are some additional measurements we would like to make over 2017, including Cloud heights using our Ceiliometer and maybe finally install a Seismograph for earth movements.
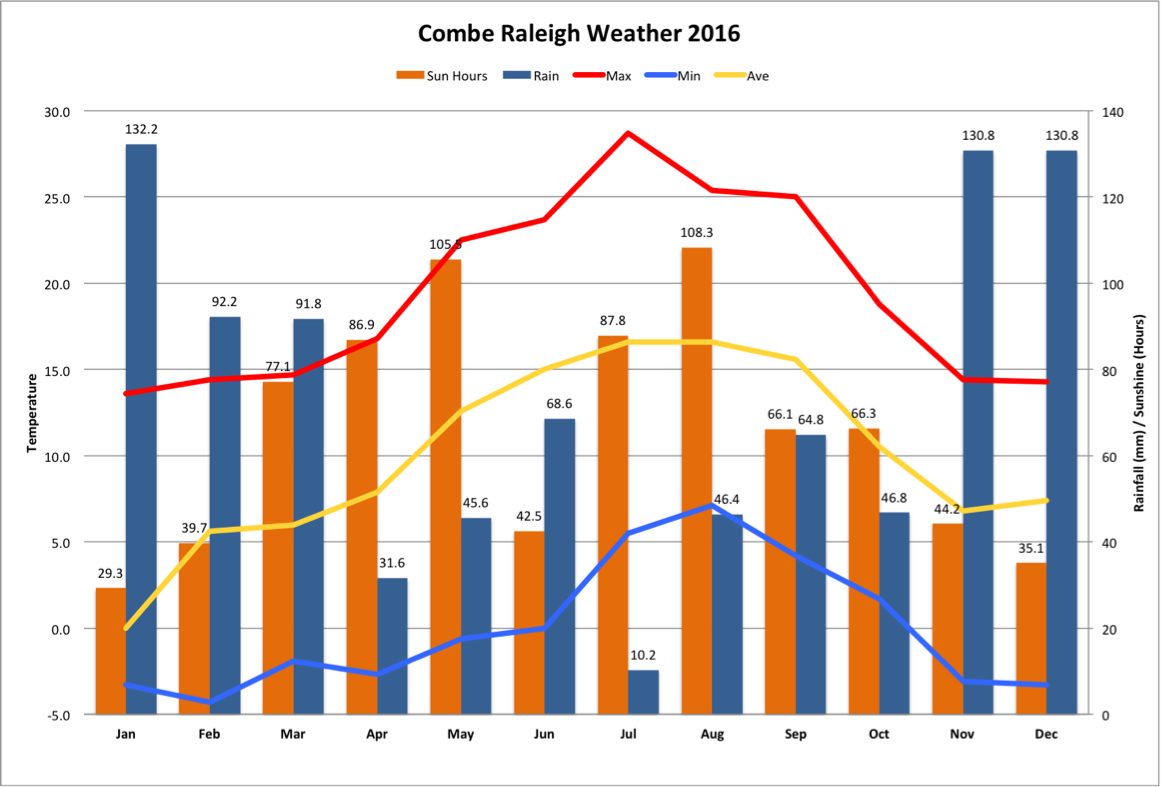
The annual rainfall over 2016 was 891.8 mm, compared with 2015 with 829.8 mm, a small increase. The wettest month by volume was January, with 132.2 mm where it rained ( > 0.2mm) for 28 days, with the wettest day being the 18th with 22.4 mm. The driest month was July, with 11 rain days and 10.2 mm. Overall the distribution of rainfall was much more in-line with the long-term averages. The Met Office yearly average for England was 852.6 mm.
Temperatures were down again from last year, with the yearly average temperature dropping to 10.6°C, from 10.8°C in 2015. The Met Office yearly average for England was 10.1°C. Over the year, temperature data recorded 36 days above 22°C, with no days dropping below -5°C. The lowest recorded temperature recorded was -4.3°C on 16th February, at 6:05am. The highest recorded temperature was 28.7°C on 19th July at 2:02pm.
May and August were the peak months for Sunshine hours, with an annual total of 788.8 Hrs. This was down again this year, but could have been affected due to the location move of the station last year, as we enjoyed some long sun days this summer.
Still no significant snow, and none recorded as accumulated on the ground however it did precipitate snow on the 18th November at around 9am. Will I ever build a Snowman in Combe Raleigh ? We had 47 ground frosts, with no Ice Days recorded (Days where the temp did not rise above 0°C).
Comparing with an average across the 5 years we have been recording weather here in Combe Raleigh, the following table shows how 2016 compared;
|
|
|
Annual Average Temp |
Annual Rainfall |
|
Ave. 2012-16 |
10.5 °C |
992.8 mm |
|
|
2012 |
9.7 °C |
1288.2 mm |
|
|
2013 |
10.1 °C |
839.4 mm |
|
|
2014 |
11.1 °C |
1115.2 mm |
|
|
2015 |
10.8 °C |
829.8 mm |
|
|
2016 |
|
10.6 °C |
891.8 mm |
Recorded weather data
Average temperature = 10.6°C
Average humidity = 87%
Average dew point = 8.5°C
Average barometer = 1015.8 mb
Average wind speed = 1.2 mph
Average gust speed = 2.8 mph
Average direction = 200° (SSW)
Rainfall for year = 891.8 mm
Maximum rain per minute = 1.0 mm/min on day 20th November at 12:22am
Maximum temperature = 28.7°C on 19th July at 2:02pm
Minimum temperature = -4.8°C on 16th February, at 7:14 am
Maximum pressure = 1044.5 mb on 2nd December at 8:49pm
Minimum pressure = 969.4 mb on day 1st November at time 12:40pm
Maximum wind speed = 16.1 mph 208°(SSW) on 28th March at 1:28am
Maximum gust speed = 35.7 mph 145°( SE) on 6th February at 2:29pm
Maximum UV Index = 8.6 on 27th June
Maximum Solar = 1350 W2m on 3rd July
Maximum Sunshine Hours = 10.5 hrs on 19th July
Total Sunshine Hours = 788.8 hrs
Maximum Radiation Exposure = 14.71 cpm ( 0.13 µSv) on 7th March
Minimum Radiation Exposure = 7.5 cpm ( 0.06 µSv) on 1st November
It was a fairly quiet meteorological year, where we experienced a fairly warm but moist summer and very few frosts over the winter. We are currently having warm weather over Christmas and New Year, which is quite unseasonal.
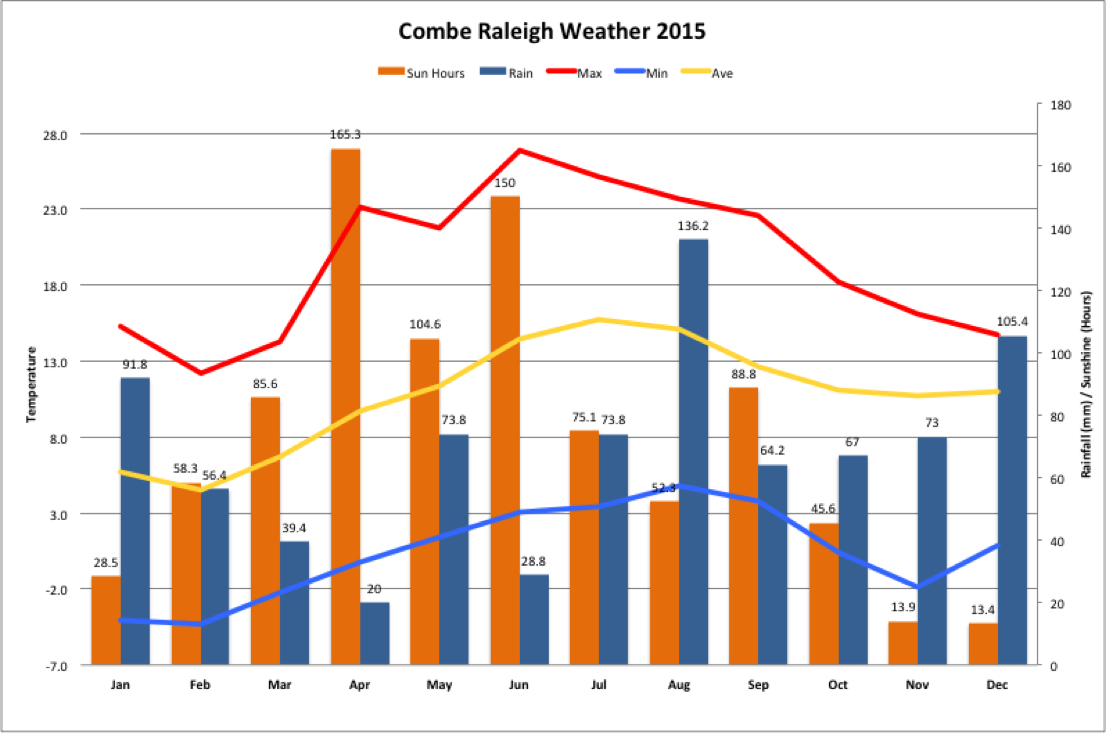
A review of the measured data points shows that 2015 has been warm, and slightly dryer than previous years, not that it feels that way at the moment!
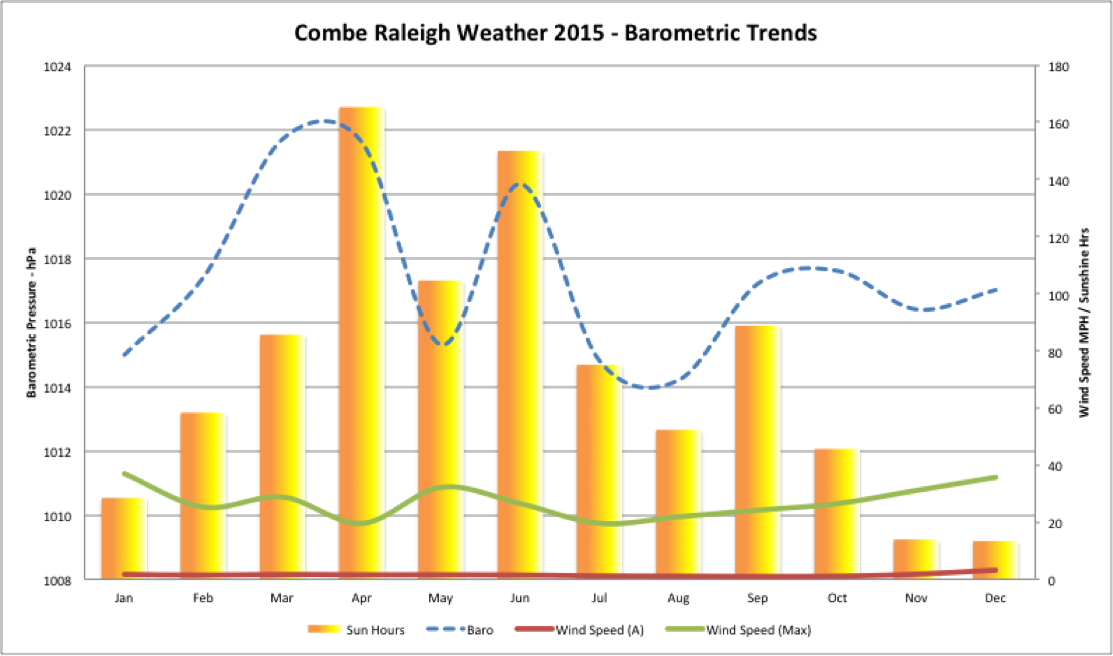
Our weather monitoring has been reliable this year, after some preventative maintenance and moving of the measurement station prior to our building work over the summer. This has had a small effect on the measurements taken, but nothing worth noting. I really must move the Anemometer to a higher position, to get a better reading for wind strength and direction, which is affected by the church tower and the woodland.
The annual rainfall over 2015 was 829.8 mm, compared with 2014 with 1115.2 mm, so moderately less rainfall. The wettest month by volume was August, with 132.6 mm where it rained for 15 days. December was notable with 29 days of rainfall. The driest month was April, with 9 rain days and 20 mm. The Met Office yearly average for England was 883 mm.
Temperatures were down from last year, with the yearly average temperature dropping to 10.8°C, from 11.1°C in 2014. The Met Office yearly average for England was 10.2°C. Over the year, temperature data recorded 15 days above 22°C, with no days dropping below -5°C. The lowest recorded temperature recorded was -4.3°C on 2nd February, at 7:14 am. The highest recorded temperature was 26.9°C on 30th June at 3:45 pm.
The Met Office confirmed that December was the warmest December since records began in 1910.
April and June were the peak months for Sunshine hours, with a total of 881.4 Hrs. This was down from last year’s value of 951.9 Hrs.
Again, we had no snow recorded but 35 ground frosts. Interestingly, there were no frosts in December because of the unseasonal warm weather.
Comparing with an average across the 4 years we have been recording weather here in Combe Raleigh, the following table shows how 2015 compared;
|
|
|
Annual Average Temp |
Annual Rainfall |
|
2012-14 |
10.3 °C |
1080.9 mm |
|
|
2012 |
9.7 °C |
1288.2 mm |
|
|
2013 |
10.1 °C |
839.4 mm |
|
|
2014 |
11.1 °C |
1115.2 mm |
|
|
2015 |
10.8 °C |
829.8 mm |
Recorded weather data
Average temperature = 10.8°C
Average humidity = 87%
Average dewpoint = 8.5°C
Average barometer = 1017.4 mb
Average windspeed = 1.6 mph
Average gustspeed = 3.4 mph
Average direction = 188° ( S )
Rainfall for year = 829.8 mm
Maximum rainfall per minute = 1.2 mm on 22nd August at 3:40 pm
Maximum temperature = 26.9°C on 30th June at 3:45 pm
Minimum temperature = -4.3°C on 2nd February at 7:14 am
Maximum pressure = 1042.6 mb on 1st February at 12:51 am
Minimum pressure = 978.5 mb on 11th January at 5:28 am
Maximum windspeed = 16.1 mph 180°( S ) on 31st December at 11:57 am
Maximum gust speed = 36.8 mph 180°( S ) on 14th January at 11:07 am
Maximum UV Index = 8.6 on 6th July
Maximum Solar = 1294 W2m on 9th June
Maximum Sunshine Hours = 11.5 hrs on 7th June
Total Sunshine Hours = 881.4 hrs
Maximum Radiation Exposure = 14.71 cpm ( 0.13 µSv) on 7th March
Minimum Radiation Exposure = 7.5 cpm ( 0.06 µSv) on 1st November
Keep visiting www.comberaleighweather.co.uk for continuous updates in real time, and weather forecasts for the local area.
We are really interested in who visits our website, so feel free to drop us a message via the contact us page. Google Analytics shows us that we have regular returning visitors from the local area, as well as further afield, both in the UK and Internationally.